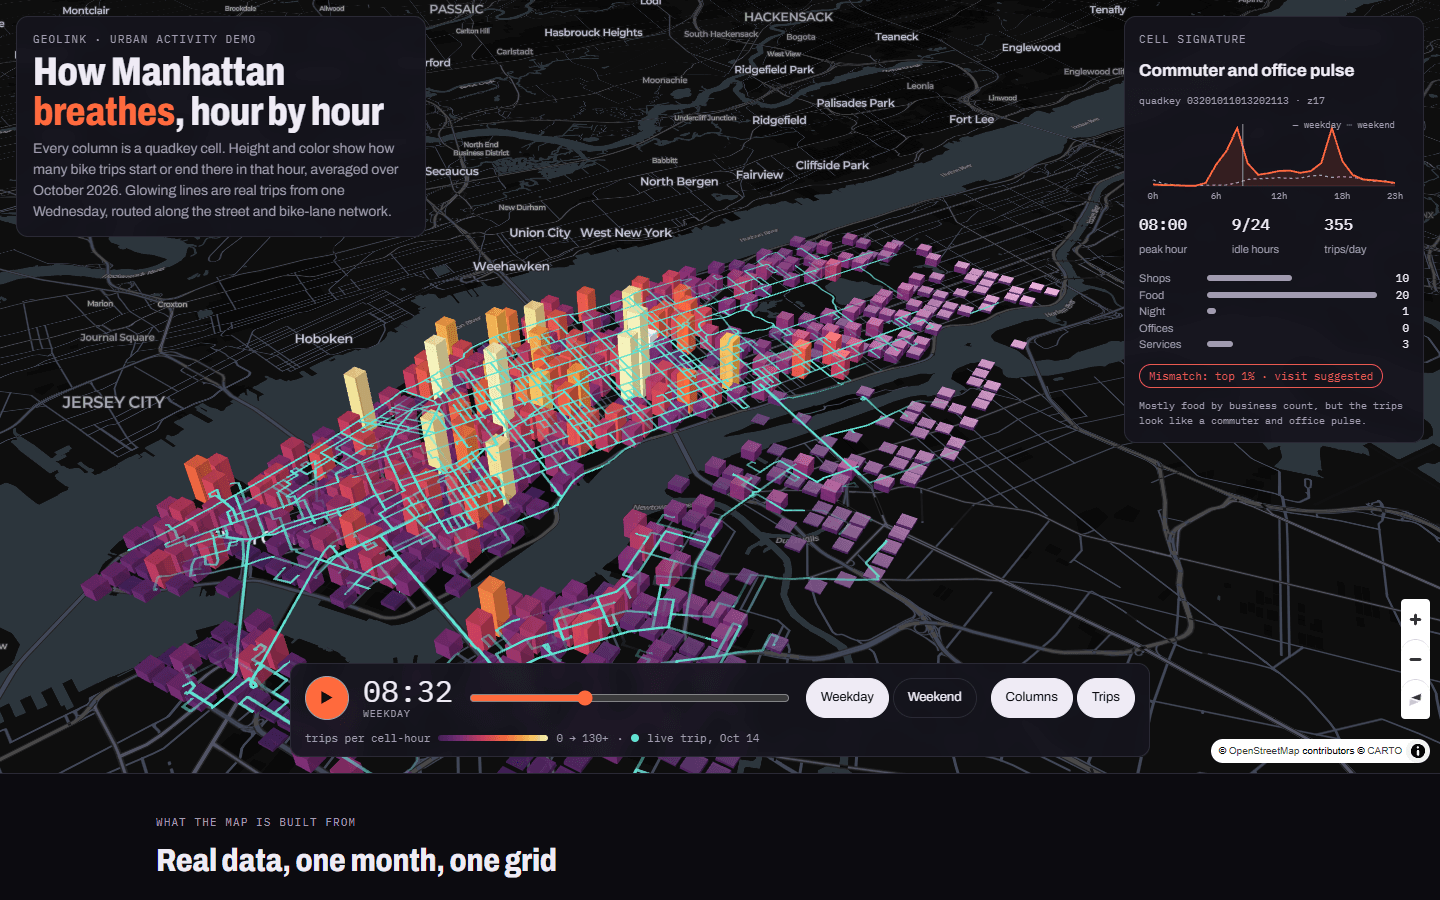
We built a working demo on public data only. A Python pipeline streams every Citi Bike trip of October 2026 (5,071,602) and every shop, restaurant, bar and office in OpenStreetMap into quadkey cells, so each cell gets its own 24-hour pulse and business mix.
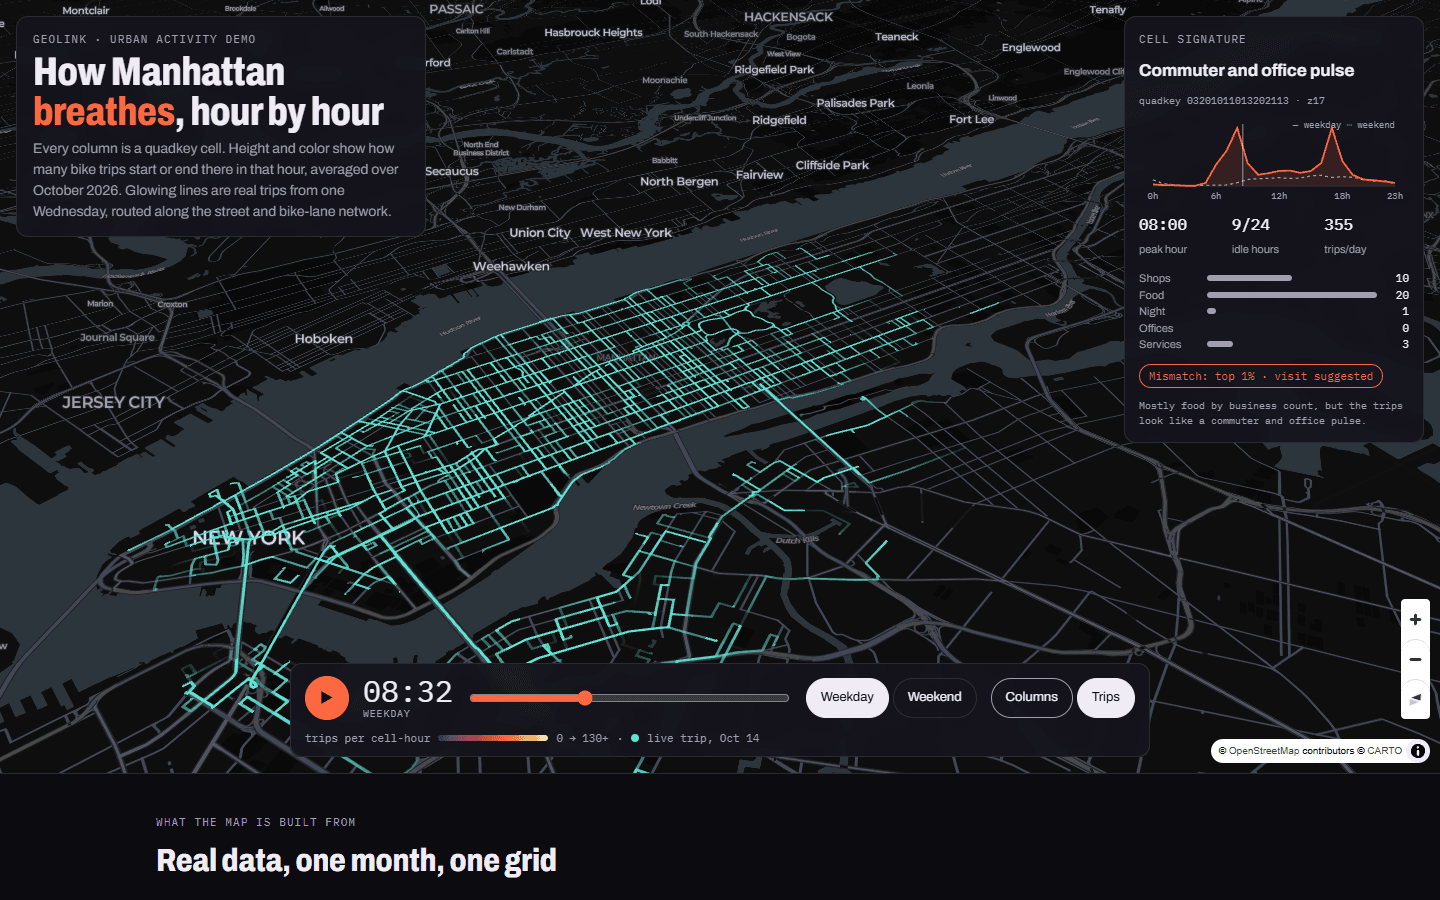
The map plays the day in 3D with deck.gl and MapLibre: columns rise and fall with activity, and 30,000 trips from one Wednesday run along the real street and bike-lane network, routed offline on OpenStreetMap. Each cell shows its signature and a mismatch score between its pulse and its business mix.
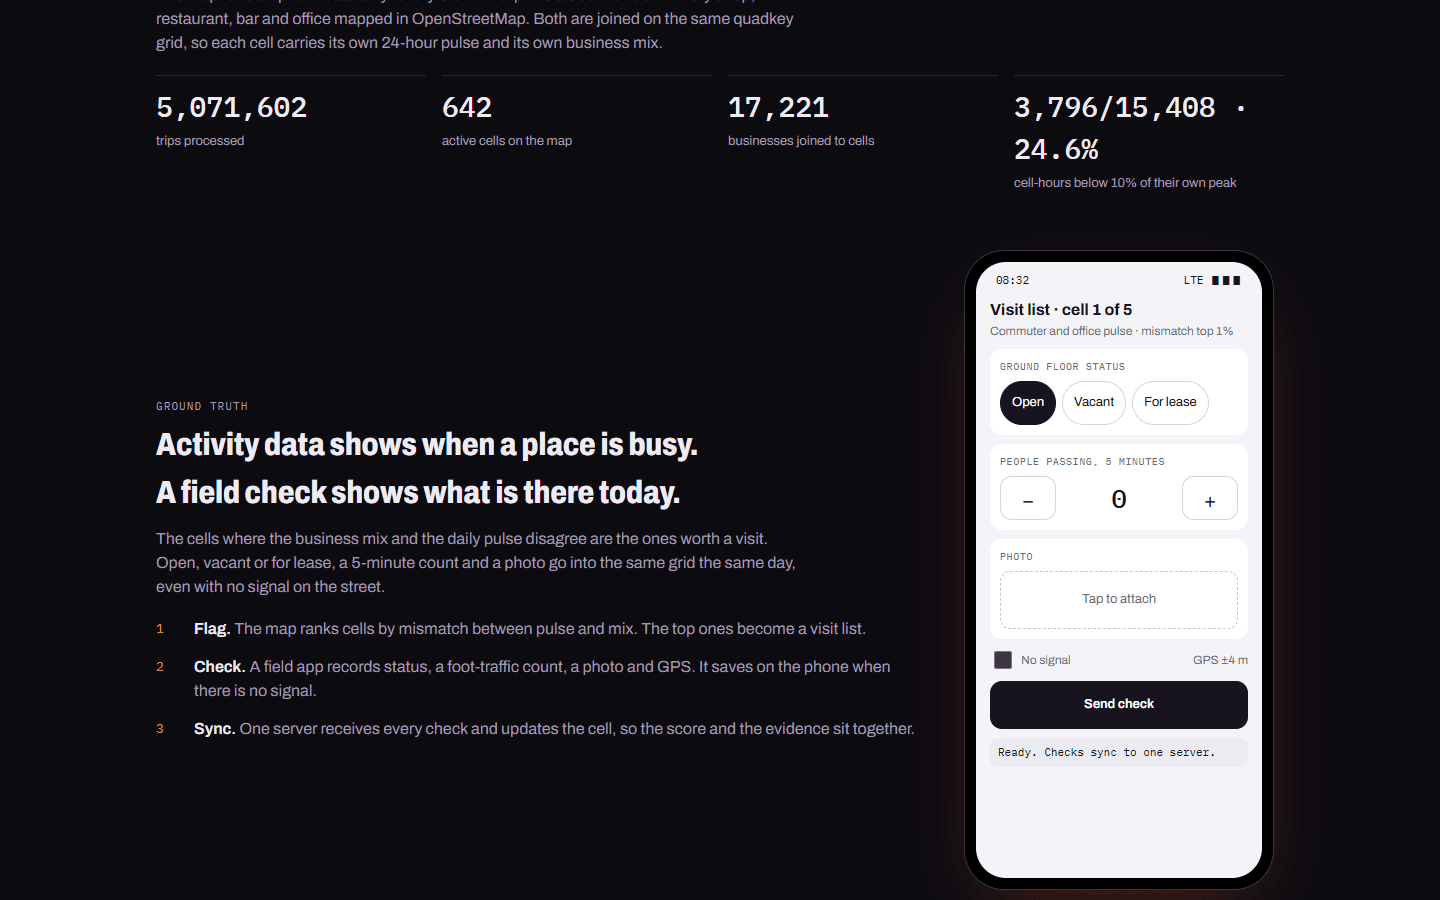
The most mismatched cells become a visit list in an in-page field app: status, a foot-traffic count and a photo, saved with no signal and synced back to the same grid.